
---~~~====~~~---
Inline style and script for pop-up message.
---~~~====~~~---
The mission of the Federal Deposit Insurance Corporation, an independent agency created by Congress, is to maintain stability and public confidence in the nation’s financial system. The FDIC also supports a statutory goal to promote and encourage creation of new minority depository institutions (MDIs).
The FDIC developed the Minority Banking Opportunity Explorer to help identify neighborhoods that may benefit from minority banking services. The tool enables users to access views of geographic data within the 50 states and could support:
- Financial Institution Organizing Groups with exploring potential business opportunities in areas that may meet the "community served" part of an MDI designation.
- Minority Depository Institutions (MDIs) with identifying potential locations for opening a new branch or advertising.
The FDIC provides this tool for informational and research purposes only.
Email us at MDIProgram@fdic.gov with feedback or questions.
Choose from the choices below to launch the tool.
Using the Minority Banking Opportunity Explorer
The Minority Banking Opportunity Explorer is an interactive map that:
- uses census tract level data to reflect areas of minority (Black American, Asian American, Hispanic American, or Native American) population greater than one standard deviation above the national average.
- uses the local distance threshold (LDT) methodology from the 2019 MDI Study and branch location data from the FDIC's Summary of Deposits (SOD).
The Minority Banking Opportunity Explorer is for informational and research purposes only.
The data or any conclusions related to this data gathered or found on this site is not reliable for any use other than its intended purpose - - to aid interested groups with identifying neighborhoods that could benefit from banking services.
This tool does not apply to or implicate any other Federal Deposit Insurance Corporation (FDIC) dataset, review, or methodology, and should not be used in any other context.
Please note that it might take a few moments for changes to show up due to the amount of census data on the map. If the map stops showing, hover over the upper left corner and click the pushpin icon to reset it.
How to filter data
The full screen view of the Minority Banking Opportunity Explorer shows a map of either the lower 48 states, Hawaii, or Alaska at the census tract level.
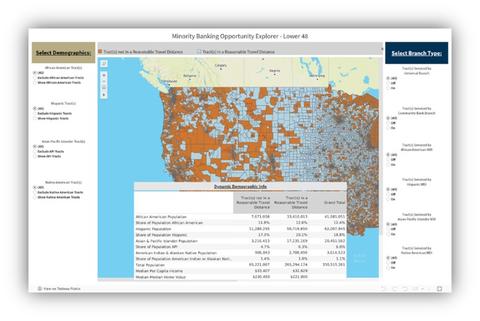
Options to filter the map include:
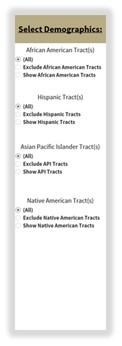
Select Demographics
Select the radio button next to the demographics you would like to show or exclude on the map.
Demographic categories are derived from the groups listed in the 2020 Census and defined by Section 308 of FIRREA.
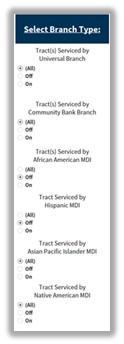
Select Branch Type
Select the radio button next to the branch type you would like to show (On) or exclude (Off) on the map.
Universal Brank Branch
A bank branch belonging to one of the four largest US institutions by asset size.
Community Bank Branch
Banking organizations with:
- Total assets < indexed size threshold
- Total assets < or equal to indexed size threshold, where:
- Loan to assets > 33%
- Core deposits to assets > 50%
- More than 1 office but no more than the indexed maximum number of offices
- Number of large Metropolitan Statistical Areas with offices < or equal to 2
- Number of states with offices < or equal to 3
- No single office with deposits > indexed maximum branch deposit size
African American MDI
Hispanic MDI
Asian Pacific MDI
Native American MDI
An Insured Depository Institution (IDI) where 51% or more of the voting stock is currently owned by the designation group, or an IDI where a majority of the board of the directors is made up of the designation group and the community that the institution serves is predominantly minority.
Select which tract(s) are highlighted on the map
Click on either of these options to dim or highlight on the map.
Map Options
When hovering over the map, Map Options appear. These options include
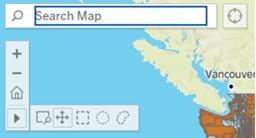
- Search
- Zoom in
- Zoom out
- Reset
- More Tools – Hover over this icon to reveal the additional tools.
- Zoom Area
- Pan
- Rectangle Selection
- Radian Selection
- Lasso Selection

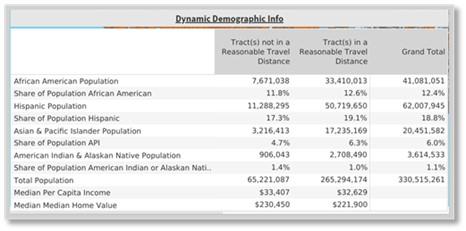
Dynamic Demographic Info Table
The Dynamic Demographic Info table reflects the data for the selections made with the filters. If no filters are used, the table shows all data.
How to navigate the map
Please note that it might take a few moments for changes to show up due to the amount of census data on the map. If the map stops showing, hover over the upper left corner and click the pushpin icon to reset it.
To find an area on the map, click the magnifying glass in the map options bar, type the city and state or zip code into the search box.
Once you have the desired view, use the radio buttons on the Demographic and Branch Type selection filters to select the demographic and branch options you would like to have displayed or removed from the map.
Click on a census tract area or use the selection tools in the map options toolbar to adjust the data in the Dynamic Demographic Info table.
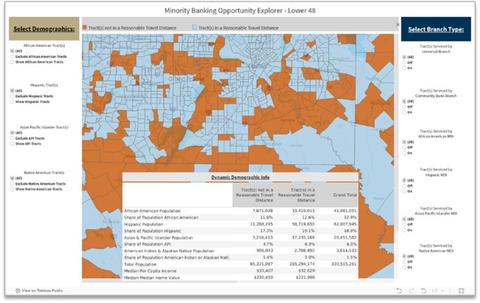
Examples
In the examples below, the African American Census Tracts are displayed along with the tracts that are not serviced by Universal Branches and Community Bank Branches. Additionally, Example 2 the Lasso Selection Tool was used to display an area of connected census tracts not in a reasonable travel distance. The Dynamic Demographic Info table now displays the data for the selections provided.
Example 1

Additionally, if you would like to see the data displayed for an individual census tract, hover above the area and a tooltip will display with that census tract data as reflected below. If you would like to see information for a different area, just hover above the new area.
Example 2

Email us at MDIProgram@fdic.gov with feedback or questions.