
FDIC-Insured Institutions Reported Net Income of $71.5 Billion
For Release
- Net Income Increased From the Prior Quarter, Driven By Lower Noninterest Expense and One-Time Gains
- Community Bank Net Income Increased Quarter Over Quarter
- The Net Interest Margin Declined Slightly, Driven by the Largest Banks
- Domestic Deposits Decreased From the Prior Quarter
- Asset Quality Metrics Remained Generally Favorable, Though Charge-Offs Increased
- Loan Balances Increased Modestly From the Prior Quarter and a Year Ago
- The Deposit Insurance Fund Reserve Ratio Increased Four Basis Points to 1.21 Percent
“The banking industry continued to show resilience in the second quarter. Net income increased and asset quality metrics remained generally favorable. However, the banking industry still faces significant downside risks from uncertainty in the economic outlook, market interest rates, and geopolitical events. In addition, weakness in certain loan portfolios, particularly office properties, credit cards, and multifamily loans, continues to warrant monitoring.”
— FDIC Chairman Martin J. Gruenberg
_______________________________
WASHINGTON— Reports from 4,539 commercial banks and savings institutions insured by the Federal Deposit Insurance Corporation (FDIC) reported aggregate net income of $71.5 billion in second quarter 2024, an increase of $7.3 billion (11.4 percent) from the prior quarter. A decline in noninterest expense and one-time gains on equity security transactions contributed to the quarterly increase. These and other financial results for second quarter 2024 are included in the FDIC’s latest Quarterly Banking Profile released today.
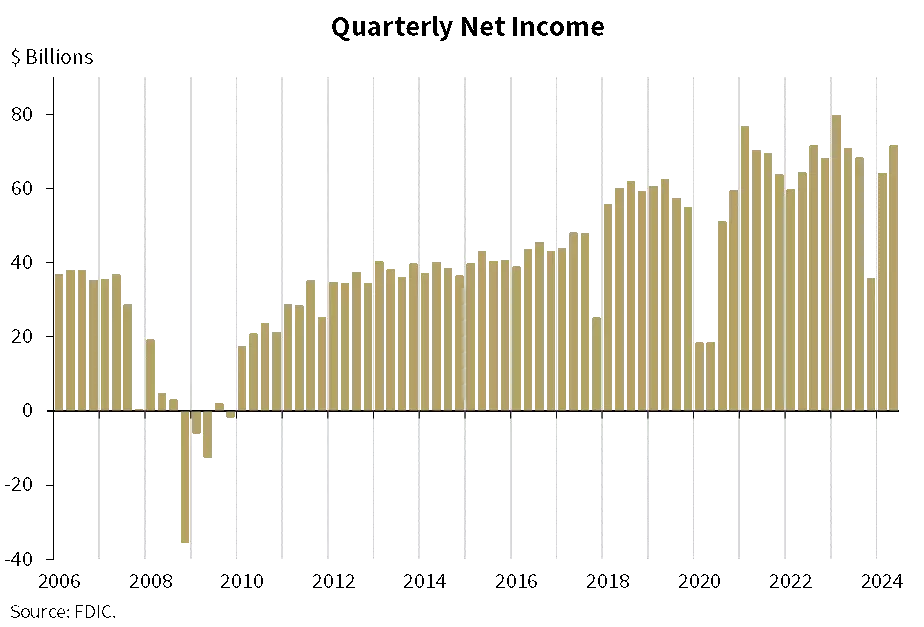
The Industry’s Net Income Increased From the Prior Quarter, Driven By Lower Noninterest Expense and One-Time Gains: Second quarter net income for the 4,539 FDIC-insured commercial banks and savings institutions increased $7.3 billion (11.4 percent) from the prior quarter to $71.5 billion. A decline in noninterest expense (down $3.6 billion, or 2.4 percent) along with higher noninterest income (up $1.2 billion, or 1.5 percent) and higher gains on the sale of securities (up $937 million) were the primary factors driving the increase in net income. Higher provision expenses offset some of the increase in net income.
The quarterly increase in net income was largely driven by nonrecurring items including an estimated $4 billion reduction in reported expense related to the FDIC special assessment, approximately $10 billion in gains on equity security transactions by large banks, and the sale of an institution’s insurance division that resulted in an after-tax $4.9 billion gain.1 These increases were partially offset by several large banks selling bond portfolios at a loss and a $2.7 billion increase in provision expense.
The banking industry reported an aggregate return-on-assets ratio (ROA) of 1.20 percent in second quarter 2024, up 12 basis points from first quarter 2024 but down one basis point from second quarter 2023.
Community Bank Net Income Increased Quarter Over Quarter: Quarterly net income for the 4,104 community banks insured by the FDIC was $6.4 billion in the second quarter, an increase of $72.6 million (1.1 percent) from first quarter 2024. Higher net interest income (up $546.4 million, or 2.7 percent) and higher noninterest income (up $253.9 million, or 5.0 percent) more than offset higher noninterest expense (up $365.7 million, or 2.1 percent) and higher provision expenses (up $140.5 million, or 18.2 percent). The community bank pretax ROA increased one basis point from last quarter to 1.14 percent.
The Net Interest Margin Declined Slightly, Driven by the Largest Banks: The industry’s net interest margin (NIM) declined one basis point to 3.16 percent in the second quarter as the growth in funding costs slightly exceeded the growth in earning-asset yields. The industry’s second quarter NIM was nine basis points below the pre-pandemic average NIM after falling below that level last quarter.2 The NIM increased quarter over quarter for all size groups except for the largest banks, those with assets over $250 billion, who in aggregate reported a four basis-point decline in the NIM. The community bank NIM of 3.30 percent increased seven basis points quarter over quarter, reversing a five-quarter declining trend, but was still 33 basis points lower than the pre-pandemic average.
Asset Quality Metrics Remained Generally Favorable, Though Charge-Offs Increased: Noncurrent loans, or loans that are 90 days or more past due or in nonaccrual status, remained unchanged from the prior quarter at 0.91 percent of total loans and well below the pre-pandemic average of 1.28 percent. Despite the stability in overall noncurrent loans, the noncurrent rate for non-owner occupied commercial real estate loans of 1.77 percent was at its highest level since third quarter 2013, driven by office portfolios at the largest banks. However, these banks tend to have lower concentrations of such loans in relation to total assets and capital than smaller institutions, mitigating the overall risk.
The industry’s net charge-off rate increased three basis points to 0.68 percent from the prior quarter and was 20 basis points higher than the year-ago quarter. This ratio was also 20 basis points above the pre-pandemic average and remained the highest quarterly rate reported by the industry since second quarter 2013. The credit card net charge-off rate was 4.82 percent in the second quarter, up 13 basis points quarter over quarter and the highest rate reported since third quarter 2011.
Loan Balances Increased Modestly From the Prior Quarter and a Year Ago: Total loan and lease balances increased $125.8 billion (1.0 percent) from the previous quarter. The increase was driven by higher loans to nondepository financial institutions (NDFIs) (up $76.0 billion, or 9.6 percent) and consumer loans (up $25.8 billion, or 1.2 percent). Much of the growth in NDFI lending appears to be due to reclassification from other existing loan categories. The majority of banks (75.1 percent) reported quarterly loan growth, and all major loan categories except construction and development loans showed quarter-over-quarter growth.
Total loan and lease balances increased by $244.5 billion (2.0 percent) from the prior year. The annual increase was also led by loans to NDFIs (up $77.5 billion, or 9.8 percent), likely due to reclassifications in the second quarter, as well as credit card loans (up $77.0 billion, or 7.5 percent) and adjustable rate 1-4 family residential mortgage loans (up $69.3 billion, or 7.5 percent). A large majority of banks (82.9 percent) reported annual loan growth.
Community banks reported a 1.7 percent increase in loan and lease balances from the previous quarter and a 6.3 percent increase from the prior year. Growth in nonfarm, nonresidential CRE loans and 1-4 family residential mortgage loans drove both the quarterly and annual increases in loan and lease balances. Loan growth was broad based across community banks with over three quarters of such banks reporting higher loan balances from the prior quarter.
Domestic Deposits Decreased From the Prior Quarter: Domestic deposits decreased $197.7 billion (1.1 percent) from first quarter 2024, well below the pre-pandemic average second-quarter growth of 0.2 percent. Both savings and transaction deposits declined from the prior quarter, with growth in small time deposits partially offsetting the declines. Brokered deposits decreased for the second straight quarter, down $10.1 billion (0.8 percent) from the prior quarter. Banks with over $250 billion in assets drove the quarterly decline in deposits.
Estimated insured deposits decreased $96.0 billion (0.9 percent) and estimated uninsured domestic deposits decreased $50.4 billion (0.7 percent) during the quarter. Banks with assets greater than $250 billion reported lower uninsured deposits in the second quarter, while banks with assets less than $250 billion reported higher uninsured deposit levels.
The Deposit Insurance Fund Reserve Ratio Increased Four Basis Points to 1.21 Percent: In the second quarter, the Deposit Insurance Fund (DIF) balance increased $3.9 billion to $129.2 billion. The reserve ratio increased four basis points during the quarter to 1.21 percent.
The Total Number of Insured Institutions Declined: The total number of FDIC-insured institutions declined by 29 during the quarter to 4,539. Three banks were sold to credit unions and 26 institutions merged with other banks during the quarter. One bank failed in the second quarter but did not file a call report in the first quarter, and no banks opened.
| 1 | Estimated losses attributable to the protection of uninsured depositors pursuant to the systemic risk determination for Silicon Valley Bank and Signature Bank, and that will be recovered through the FDIC special assessment, were $19.2 billion as of June 30, 2024, unchanged from March 31, 2024. The industry reported approximately $4 billion in additional expense for the special assessment in first quarter 2024, and no expense in the second quarter. |
| 2 | The “pre-pandemic average” refers to the period of first quarter 2015 through fourth quarter 2019 and is used consistently throughout this press release. |