
Perspective
Most unbanked households in the United States are “cash only,” meaning they use neither prepaid cards nor nonbank payment apps. These households must rely primarily on in-person cash transactions and thus are at risk of theft or loss when handling their day-to-day finances. Going forward, the cash-only unbanked may find it increasingly difficult to participate in the formal economy as the U.S. financial system evolves toward a more digital infrastructure. Economic inclusion strategies targeted toward the cash-only unbanked should focus on building trust in banks and demonstrating the value of a bank account, as this population appears to be especially disconnected from the mainstream banking system.
Key Findings
- About six in ten unbanked households are cash only. These households are disproportionately older, more likely to be Hispanic, and less likely to be Black compared to other unbanked households.
- Cash-only unbanked households also are less likely to have previously had a bank account or to express interest in having a bank account. They are more likely to cite “don’t trust banks” as the main reason for not having an account.
- The remaining (four in ten) unbanked households use prepaid cards or nonbank payment apps. Many such households use these products to substitute for the core services traditionally provided by a bank account, including paying bills and receiving income.
Overview
Expanding households’ participation in the banking system has long been a focus of public policy in the United States.1 However, the U.S. financial services market has evolved in recent years and alternatives to bank accounts are now widely available, including General Purpose Reloadable Cards (“prepaid cards”) and nonbank online payment services like PayPal, Venmo, or Cash App (“nonbank payment apps”). These products resemble bank accounts, though they may not offer the full consumer protections provided by banks and credit unions. In addition, the benefits and risks associated with these products differ from those associated with using cash.
This brief uses data from the 2021 FDIC National Survey of Unbanked and Underbanked Households (“2021 FDIC Household Survey”) to investigate the extent to which unbanked households use prepaid cards and nonbank payment apps, which we collectively refer to as “other transaction products,” to substitute for bank accounts. This brief also explores how many unbanked households use neither transaction product and presumably rely primarily on cash to handle basic financial tasks.2
We show that, among the estimated 4.5 percent of U.S. households that were unbanked in 2021, six in ten used neither prepaid cards nor nonbank payment apps. Overall, about 2.6 percent of U.S. households (about 3.5 million households) were in this “cash-only” unbanked group. The remaining four in ten unbanked households used at least one of these other transaction products. At the time of the survey, the latter group made up about 1.8 percent (2.4 million households) of all U.S. households.
These two segments of the unbanked population differed in important ways. Relative to unbanked households that used other transaction products, cash-only unbanked households were disproportionately older; more likely to be Hispanic; and less likely to be Black.3 Cash-only unbanked households were also less likely to have previously had a bank account, less likely to express interest in having a bank account, and more likely to cite “don’t trust banks” as a main reason for not having an account.
We further show unbanked households that used prepaid cards or nonbank payment apps often did so to handle basic financial tasks that are traditionally provided by bank accounts. In particular, many such households used these products to pay monthly bills for rent, mortgages, utilities, or childcare, or to receive income from work, retirement, or a government agency. Unbanked households also commonly used prepaid cards and nonbank payment apps to make in-person and online purchases, underscoring how these products provide access to digital payments that unbanked households would not otherwise have. But these households may not receive the full set of consumer protections provided by bank accounts, and consumers who use other transaction products do not accrue the potential benefits from developing a relationship with a bank or credit union.
The following analysis provides more detail on U.S. households’ use of bank accounts, prepaid cards, and nonbank payment apps. We highlight differences between cash-only unbanked and other unbanked households and discuss the implications of these findings for policymakers and other stakeholders.
Unbanked Households’ Use Of Prepaid Cards And Nonbank Payment Apps
Prepaid cards and nonbank payment apps offer similar functionality to bank accounts—for example, by allowing users to directly deposit a paycheck, make purchases in person or online, or withdraw cash from ATMs.4 But to what extent do unbanked households use these other transaction products to meet their basic financial-transaction needs?
Table 1. Use of Nonbank Transaction Accounts, by Bank Account Ownership
A. Unbanked Households
| Use of Other Transaction Products | Neither (Cash Only) | Only Prepaid Cards | Only Nonbank Payment Apps | Both | All Unbanked |
|---|---|---|---|---|---|
| Number (1000s) | 3,501 | 1,334 | 465 | 606 | 5,907 |
| Percent of All | 2.6 | 1.0 | 0.4 | 0.5 | 4.5 |
| Percent of Unbanked | 59.3 | 22.6 | 7.9 | 10.3 | 100.0 |
B. Banked Households
| Use of Other Transaction Products | Neither | Only Prepaid Cards | Only Nonbank Payment Apps | Both | All Banked |
|---|---|---|---|---|---|
| Number (1000s) | 63,253 | 2,911 | 56,168 | 4,279 | 126,610 |
| Percent of All | 47.7 | 2.2 | 42.4 | 3.2 | 95.5 |
| Percent of Banked | 50.0 | 2.3 | 44.4 | 3.4 | 100.0 |
Notes: Estimates calculated using the 2021 FDIC Household Survey data. Numbers in columns may not sum to totals due to rounding.
Table 1 uses data from the 2021 FDIC Household Survey to describe overall patterns of account ownership among U.S. households. Panel A shows that, as reported in FDIC (2022), an estimated 4.5 percent of U.S. households were unbanked in 2021. Of these unbanked households, about six in ten (59.3 percent) were neither using prepaid cards nor nonbank payment apps at the time of the survey. About 3.5 million unbanked households (2.6 percent of all U.S. households) were in this cash-only group. The remaining four in ten unbanked households were using at least one of these other transaction products, comprising 1.8 percent of all U.S. households or 2.4 million households in total. About one-third of unbanked households used a prepaid card (32.9 percent), and nearly one-fifth (18.2 percent) used a nonbank payment app.5
Figure 1 shows that among unbanked households that used prepaid cards or nonbank payment apps, many used those products in ways that substitute for some of the core services bank accounts provide.6 In particular, about 74 percent used at least one of these products to pay bills, 59 percent used one to receive income, and 39 percent used one to build savings or keep money in a safe place. Unbanked households that used other transaction products also commonly did so to make purchases, both in person (73 percent) and online (57 percent). By adopting these products, unbanked households gain access to electronic payment networks from which cash-only unbanked households are likely to be excluded.7
Figure 1. How Households Use Other Transaction Accounts, by Bank Account Ownership (Percent of Households)
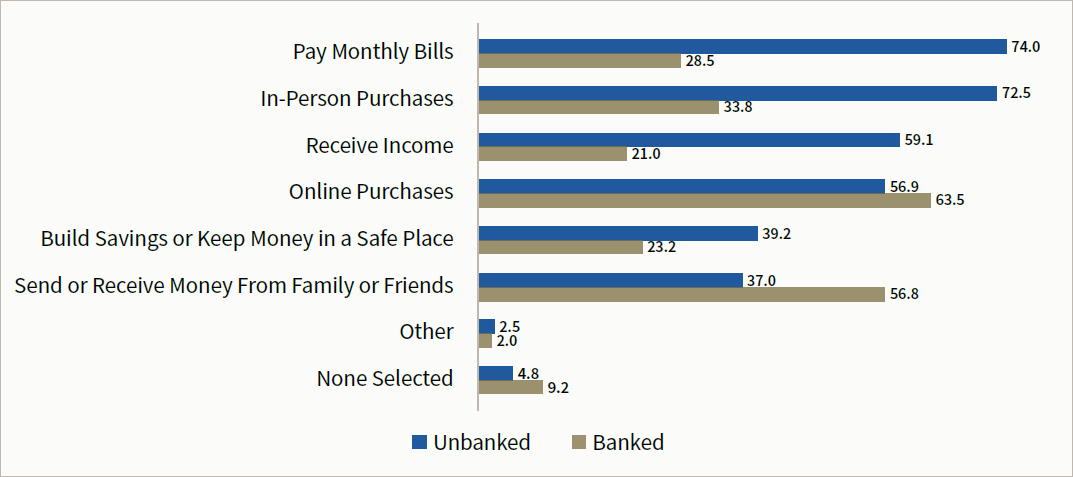
Notes: Estimates calculated using the 2021 FDIC Household Survey data on households that used a prepaid card or nonbank payment apps.
How Do Cash-Only Unbanked Households Differ From Those That Use Other Transaction Products?
Understanding how cash-only unbanked households differ from those that use other transaction products can help policymakers and other stakeholders target their efforts to increase participation in the banking system. Figure 2 highlights differences in unbanked households’ use of other transaction products by selected demographic and socioeconomic groups. Table 2 provides information about the relative size of the unbanked and cash-only unbanked population for the same groups.
Differences in Household Characteristics
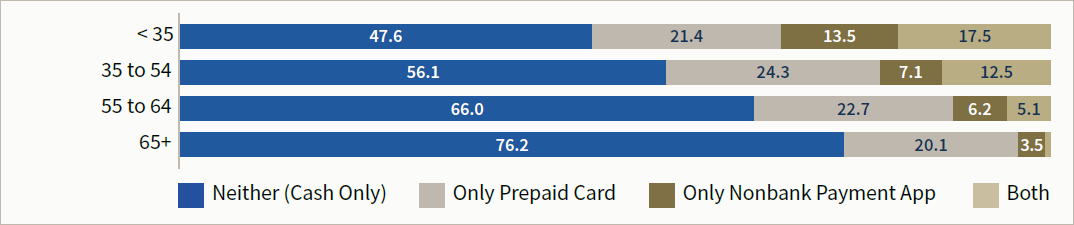
Figure 2, Panel A shows age is a key factor in determining whether an unbanked household adopts any other transaction products—in particular, nonbank payment apps.8 About 76 percent of unbanked households aged 65 or older were cash only, compared to 48 percent of those under age 35. However, because unbanked rates generally decline with age, the cash-only unbanked as a proportion of all households is fairly similar across age groups. For example, as illustrated in Table 2, about 2.5 percent of households under age 35 are cash-only unbanked, compared to 2.1 percent among households aged 65 or older.
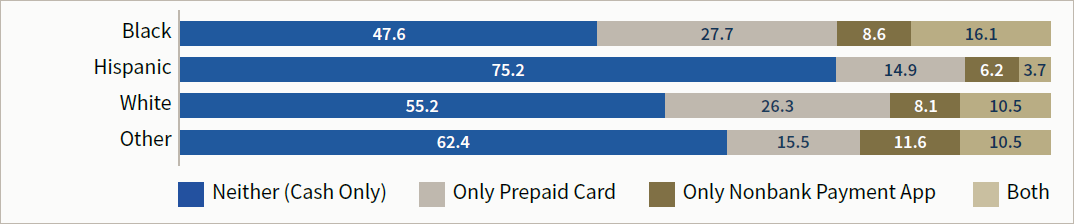
Figure 2, Panel B shows unbanked households’ use of other transaction products also varies substantially by race and ethnicity. Notably, less than half (48 percent) of Black unbanked households were cash only, compared to about three-fourths (75 percent) among Hispanic unbanked households. These patterns follow from Hispanic households’ lower propensity to use nonbank payment apps when compared to other racial and ethnic groups, whereas Black households have a higher propensity to use prepaid cards, as shown in FDIC (2022). Overall, as Table 2 shows, about 5.4 percent of Black households and 7.0 percent of Hispanic households were cash-only unbanked, compared to about 1.2 percent of White households.
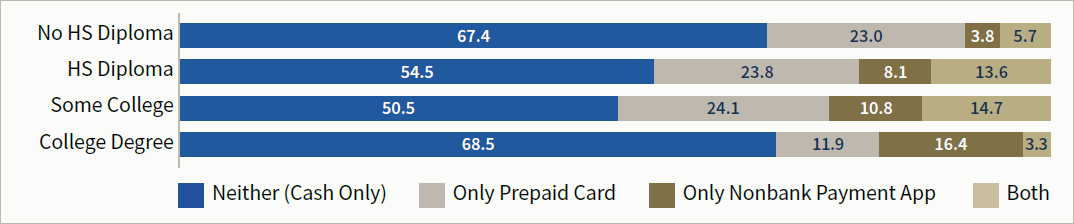
In contrast with age or race and ethnicity, differences by education and family income show no clear pattern in the likelihood an unbanked household is cash only, as shown in Figure 2, Panels C and D. This lack of correlation is partly because, as illustrated in FDIC (2022), an increase in income or level of education decreases the likelihood an unbanked household has used prepaid cards but increases the likelihood that household has used online payment services. Yet because overall unbanked rates are substantially higher for households with the least education and income, it follows cash-only unbanked rates are higher for these groups as well. Table 2 shows the cash-only unbanked make up 13 percent of all U.S. households without a high school (HS) diploma and 11 percent of households with income below $15,000, respectively.9
Figure 2. Unbanked Households' Use of Nonbank Transaction Products, by Selected Household Characteristics (Percent of Households)
A. Age
B. Race and Ethnicity
C. Education
D. Family Income

Notes: Estimates calculated using the 2021 FDIC Household Survey data on unbanked households. In Panel A, to make the data labels legible we exclude the percentage of households aged 65 or older that used both prepaid cards and nonbank payment apps (0.3 percent).
Table 2. Unbanked and Cash-Only Unbanked Rates, by Selected Household Characteristics
| All Households (1000s) | Unbanked Households (1000s) | Percent Unbanked | Percent Cash-Only Unbanked | |
|---|---|---|---|---|
| All | 132,517 | 5,907 | 4.5 | 2.6 |
| Age | ||||
| < 35 | 27,394 | 1,435 | 5.2 | 2.5 |
| 35 to 54 | 44,914 | 2,332 | 5.2 | 2.9 |
| 55 to 64 | 24,582 | 1,172 | 4.8 | 3.1 |
| 65+ | 35,627 | 968 | 2.7 | 2.1 |
| Race and Ethnicity | ||||
| Black | 16,933 | 1,916 | 11.3 | 5.4 |
| Hispanic | 19,368 | 1,793 | 9.3 | 7.0 |
| White | 86,037 | 1,809 | 2.1 | 1.2 |
| Other | 10,180 | 388 | 3.8 | 2.4 |
| Education | ||||
| No HS Diploma | 10,492 | 2,015 | 19.2 | 12.9 |
| HS Diploma | 32,235 | 2,192 | 6.8 | 3.7 |
| Some College | 36,886 | 1,199 | 3.3 | 1.6 |
| College Degree | 52,904 | 500 | 0.9 | 0.6 |
| Family Income | ||||
| < $15,000 | 12,547 | 2,479 | 19.8 | 11.4 |
| $15,000 to $30,000 | 17,889 | 1,639 | 9.2 | 5.6 |
| $30,000 to $50,000 | 24,617 | 980 | 4.0 | 2.2 |
| >= $50,000 | 77,464 | 809 | 1.0 | 0.7 |
Notes: Estimates calculated using the 2021 FDIC Household Survey data.
Differences in Attitudes and Experiences
The cash-only unbanked tend to have less experience with bank accounts and less interest in having a bank account in the future. Figure 3 shows about 60 percent of the cash-only unbanked had never adopted a bank account, compared to about 38 percent of unbanked households that had used a prepaid card or nonbank payment app. And Figure 4 shows about 24 percent of cash-only unbanked households are “very” or “somewhat” interested in having a bank account, compared to about 32 percent of those that had used other transaction products.
Figure 3. Unbanked Households' Previous Banking Status, by Use of Other Transaction Products (Percent of Unbanked Households)
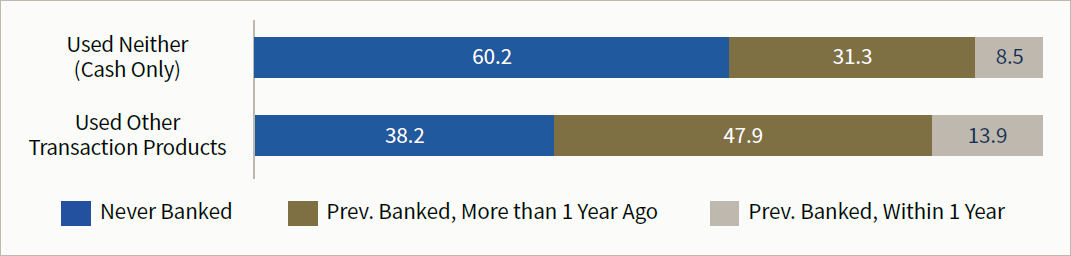
Notes: Estimates calculated using the 2021 FDIC Household Survey.
Figure 4. Unbanked Households' Interest in Having a Bank Account, by Use of Other Transaction Products (Percent of Unbanked Households)
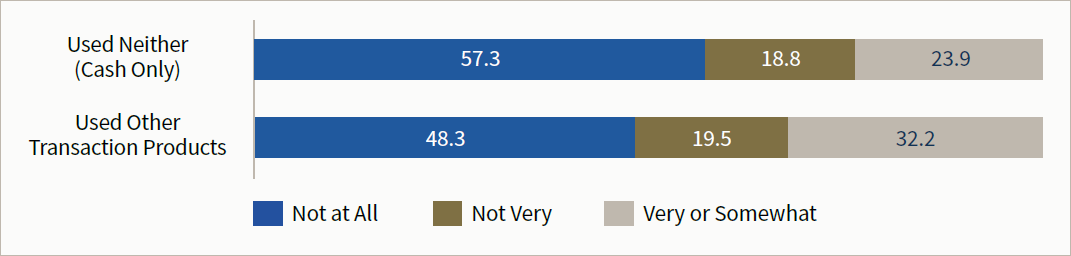
Notes: Estimates calculated using the 2021 FDIC Household Survey.
Finally, Figure 5 summarizes the main reasons unbanked households cited for not having a bank account. Overall, these reasons were fairly similar for the cash-only unbanked when compared with unbanked households that used other transaction products. For both groups, “not enough money to meet minimum balance requirements” was the most commonly cited main reason for not having a bank account. Yet a higher proportion of cash-only unbanked households cited “do not trust banks” as the main reason for not having a bank account when compared with unbanked households that used other transaction accounts. Conversely, the latter were more likely to cite “avoiding a bank gives more privacy” or “problems with past banking or credit history” as the main reasons for not having an account.
Figure 5. Unbanked Households' Main Reason for Not Having a Bank Account, by Use of Other Transaction Products (Percent of Unbanked Households)
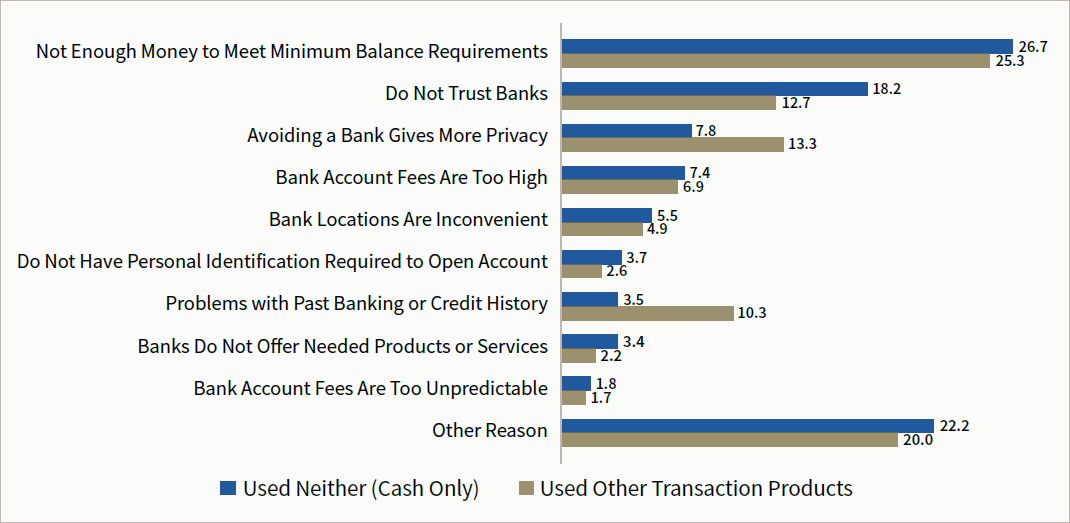
Notes: Estimates calculated using the 2021 FDIC Household Survey data, excluding households that did not select any of the reasons provided.
Implications
A primary implication of the results presented in this article is that policymakers and other stakeholders who focus on encouraging economic inclusion could prioritize the cash-only unbanked. As of 2021, approximately 3.5 million U.S. households (2.6 percent of all U.S. households) were unbanked and had adopted neither prepaid cards nor accounts with nonbank payment apps. Such households must rely primarily on in-person cash transactions to handle their day-to-day finances, putting them especially at risk of theft or loss. Further, as the U.S. financial system continues to evolve toward a more digital infrastructure, these households may find it increasingly difficult to take part in the formal economy.10
The cash-only unbanked are distinct from other unbanked households in their demographic composition as well as their experiences with and perceptions of the banking system. For example, relative to unbanked households that use other transaction products, the cash-only unbanked are older, more likely to be Hispanic, and less likely to be Black. Cash-only unbanked households are also less likely to have previously adopted a bank account, less interested in having an account, and more likely to say they “don’t trust banks.” In other words, cash-only unbanked households appear to be less connected to the mainstream banking system. Economic inclusion strategies targeted toward this population should focus on building trust in banks and demonstrating the potential value of a bank account.
The remaining segment of the unbanked population, which totaled 2.4 million households (1.8 percent of all U.S. households) in 2021, use prepaid cards and nonbank payment apps in ways that are functionally similar to the services a bank account provides. In particular, many unbanked households used these products to pay bills or receive income. In addition, unbanked households commonly used prepaid cards and nonbank payment apps to make purchases in person and online, underscoring that these products offer households the ability to make payments electronically.
With this point in mind, some readers might ask whether, for these households, prepaid cards or nonbank payment apps are an adequate substitute for a bank account. One important consideration is whether such products provide households with the full benefit of consumer protections that apply to insured depository accounts. Bank accounts offer federal deposit insurance and other consumer protections, providing consumers a safe place to keep deposits, conduct financial transactions, and build savings. In contrast, the protections associated with prepaid cards and nonbank payment apps are not always clear.11
Further, households that use prepaid cards and nonbank payment apps may miss the ancillary benefits of establishing a relationship with a banking institution. For example, bank accounts may facilitate access to credit products that can be used to smooth consumption in the event of income or expense shocks as well as loans for small businesses or the purchase of a home (for example, see Barr (2012), Brevoort and Kambara (2017), and FDIC (2018). Whether using prepaid cards or nonbank payment apps could offer similar benefits is an open question.12
More broadly, further research could help to explain why these households use other transaction products instead of opening a bank account. For example, are the consumer protection benefits of having a bank account salient for and valued by unbanked households? To what extent are consumers using prepaid cards or nonbank payment apps because of privacy concerns, barriers to opening a bank account due to past banking problems, or a lack of trust in banks? Do safe accounts, such as those that meet the Bank on National Account Standards (Cities for Financial Empowerment 2023), offer product features these households value, such as low monthly maintenance fees, no or low minimum balance requirements, and no overdraft fees? Answers to these questions can help to inform economic inclusion efforts tailored to this segment of the unbanked population going forward.
Ryan Goodstein is a Senior Economist in the Division of Depositor and Consumer Protection at the FDIC.
Suggested Citation:
Goodstein, Ryan. A Closer Look at the Unbanked: Cash-Only Households Versus Those That Use Prepaid Cards or Nonbank Payment Apps. Consumer Research Perspectives, Federal Deposit Insurance Corporation, July 2024
Endnotes
| 1 | The Federal Deposit Insurance Corporation (FDIC) chartered an Advisory Committee on Economic Inclusion in November 2006; the committee periodically convenes to provide the FDIC with advice and recommendations on important initiatives focused on expanding access to banking services by underserved populations. The U.S. Department of the Treasury’s Office of Consumer Policy has engaged in several initiatives to increase low- and moderate-income households’ access to financial services and financial education dating back to (at least) 2008. More recently, the FDIC has embarked on a #Get-Banked public awareness campaign to encourage unbanked households to open insured accounts, for example, working with the Treasury Department and the Internal Revenue Service (IRS) to encourage households to open a bank account to facilitate receipt of Economic Impact Payments following the COVID-19 pandemic. |
| 2 | As shown in FDIC (2018), unbanked households rely heavily on cash and other paper-based instruments to handle their basic financial- transaction needs. In 2017, for example, about 66 percent of unbanked households typically paid bills using cash, and 39 percent used nonbank money orders. Further, about 45 percent of unbanked households typically received income by paper check or money order, and 27 percent typically received income in cash. More recently, Cubides and O’Brien (2023) note that cash plays a central role in how unbanked households purchase goods and services, and that this has continued through the COVID-19 pandemic. |
| 3 | All differences highlighted in this article are statistically significant at the 10-percent level, unless noted otherwise. |
| 4 | In the case of nonbank payment apps like PayPal, Venmo, or Cash App, the user can obtain a debit card linked to the account to facilitate in-person purchases or cash withdrawals from ATMs. |
| 5 | While not the focus of this study, Panel B of Table 1 shows that among banked households, half (50.0 percent) were not using any other transaction products at the time the survey was conducted. Households that used other transaction products had primarily adopted online payment apps; use of prepaid cards was uncommon among banked households. |
| 6 | Figure 1 illustrates how unbanked households collectively used their prepaid cards and nonbank payment apps. For details on how unbanked households used these products individually, see FDIC (2022), Tables 6.2 and 6.6, respectively. |
| 7 | In contrast to the unbanked population, banked households that used other transaction products less commonly did so to pay bills, receive income, or build savings. Almost all banked households used their bank accounts to handle these basic financial tasks, as shown in FDIC (2022), Table 5.3. |
| 8 | For person-level characteristics such as race, age, and education, this study used the characteristics of the householder (generally, the person or one of the people in whose name the home is owned or rented) to represent the household. |
| 9 | Reflecting the patterns in Figure 2, Appendix Table A1 shows the composition of unbanked households over selected household characteristics differs by the adoption of other transaction products. Panel A of this table illustrates that, relative to those unbanked households that used a prepaid card or nonbank payment app, cash-only unbanked households were disproportionately older than 55, more likely to be Hispanic, and less likely to be Black. |
| 10 | For example, Wang (2019) notes that as some businesses go “cashless,” consumers that transact primarily in cash may be denied goods and services. Perkins (2019) (PDF) and Bostic et al. (2020) discuss the potential impact of digital payment innovations in the U.S., pointing out that while they offer increased convenience to many, consumers that rely primarily on cash may be further marginalized. Bostic et al. (2023) highlight ways the new payment platform introduced by the Federal Reserve (the FedNow Service®) can advance financial and economic inclusion. |
| 11 | For example, FDIC deposit insurance applies only to deposits at FDIC-insured banks and savings associations. In some instances, nonbanks and issuers of prepaid cards can deposit consumers’ funds at FDIC-insured banks with the intent that pass-through coverage will be available, meaning the funds would be insured as if they had been deposited at the bank in the name of the consumer. If certain requirements are satisfied, then each consumer’s funds are separately insured in the event of the bank’s failure. The Consumer Financial Protection Bureau (2023) recently highlighted the potential risks of holding funds in nonbank payment apps in a Consumer Advisory blog post. |
| 12 | Some nonbank payment apps now offer credit cards or other forms of unsecured credit to their consumers, in partnership with an insured depository institution. (See, for instance, PayPal Credit or the Venmo Credit Card.) |
References
Barr, Michael. 2012. No Slack: The Financial Lives of Low-Income Americans. Washington DC: Brookings Institution Press.
Bostic, Raphael, Shari Bower, Oz Shy, Larry Wall, and Jessica Washington. 2020. “Shifting the Focus: Digital Payments and the Path to Financial Inclusion.” Federal Reserve Bank of Atlanta. https://www.atlantafed.org/-/media/documents/promoting-safer-payments-innovation/publications/2020/09/30/shifting-the-focus-digital-payments-and-the-path-to-financial-inclusion/Shifting-the-Focus-Digital-Payments-and-the-Path-to-Financial-Inclusion.pdf.
Bostic, Raphael, Mark Gould, Julian Alcazar, Shaun O’Brien, Lali Shaffer, and Jessica Washington. 2023. “Connecting the Dots: How Adoption of Instant Payments Can Lead to a More Inclusive Economy.” Federal Reserve Bank of Atlanta. https://www.atlantafed.org/-/media/documents/banking/payments-inclusion/2023/07/12/connecting-the-dots-instant-payments.pdf.
Brevoort, Kenneth P. and Michelle Kambara. 2017. “CFPB Data Point: Becoming Credit Visible.” Consumer Financial Protection Bureau Office of Research. https://files.consumerfinance.gov/f/documents/BecomingCreditVisible_Data_Point_Final.pdf.
Cities for Financial Empowerment Fund. 2023. “Bank On National Account Standards (2023- 2024).” https://joinbankon.org/wp-content/uploads/2022/08/Bank-On-National-Account-Standards-2023-2024.pdf.
Consumer Financial Protection Bureau. 2023. “Consumer advisory: Your money is at greater risk when you hold it in a payment app, instead of moving it to an account with deposit insurance.” https://www.consumerfinance.gov/about-us/newsroom/consumer-advisory-your-money-is-at-greater-risk-when-you-hold-it-in-a-payment-app-instead-of-moving-it-to-an-account-with-deposit-insurance/.
Cubides, Emily and Shaun O’Brien. 2023. “2023 Findings from the Diary of Consumer Payment Choice.” Federal Reserve Financial Services. https://www.frbsf.org/wp-content/uploads/sites/7/2023-Findings-from-the-Diary-of-Consumer-Payment-Choice.pdf.
Federal Deposit Insurance Corporation (FDIC). 2018. “2017 FDIC National Survey of Unbanked and Underbanked Households.” https://www.fdic.gov/analysis/household-survey/2017/2017report.pdf.
Federal Deposit Insurance Corporation (FDIC). 2022. “2021 FDIC National Survey of Unbanked and Underbanked Households.” https://www.fdic.gov/analysis/household-survey/2021report.pdf.
Perkins, David W. 2019. “Long Live Cash: The Potential Decline of Cash Usage and Related Implications.” Congressional Research Service. https://sgp.fas.org/crs/misc/R45716.pdf.
Wang, Claire. 2019. “Cash Me If You Can: The Impacts of Cashless Businesses on Retailers, Consumers, and Cash Use.” Cash Product Office Federal Reserve System. https://www.frbsf.org/wp-content/uploads/sites/7/Cash-Me-If-You-Can-August2019.pdf.
Appendix Table A1. Composition of Households Over Selected Household Characteristics, by Use of Other Transaction Products and by Bank Account Ownership
| A. Unbanked by Use of Other Transaction Products | B. By Bank Account Ownership | ||||||
|---|---|---|---|---|---|---|---|
| Neither (Cash Only) | Only Prepaid Cards | Only Nonbank Payment Apps | Both | Unbanked | Banked | All | |
| HHs (1000s) | 3,501 | 1,334 | 465 | 606 | 5,907 | 126,610 | 132,517 |
| Column Percent | 100.0 | 100.0 | 100.0 | 100.0 | 100.0 | 100.0 | 100.0 |
| Age | |||||||
| < 35 | 19.5 | 23.0 | 41.7 | 41.5 | 24.3 | 20.5 | 20.7 |
| 35 to 54 | 37.4 | 42.5 | 35.5 | 48.1 | 39.5 | 33.6 | 33.9 |
| 55 to 64 | 22.1 | 19.9 | 15.6 | 9.9 | 19.8 | 18.5 | 18.6 |
| 65+ | 21.1 | 14.6 | 7.2 | 0.5 | 16.4 | 27.4 | 26.9 |
| Race and Ethnicity | |||||||
| Black | 26.1 | 39.8 | 35.3 | 51.0 | 32.4 | 11.9 | 12.8 |
| Hispanic | 38.5 | 20.1 | 23.7 | 11.0 | 30.4 | 13.9 | 14.6 |
| White | 28.5 | 35.6 | 31.3 | 31.2 | 30.6 | 66.5 | 64.9 |
| Other | 6.9 | 4.5 | 9.7 | 6.7 | 6.6 | 7.7 | 7.7 |
| Education | |||||||
| No HS Diploma | 38.8 | 34.8 | 16.6 | 19.0 | 34.1 | 6.7 | 7.9 |
| HS Diploma | 34.1 | 39.1 | 38.0 | 49.3 | 37.1 | 23.7 | 24.3 |
| Some College | 17.3 | 21.6 | 27.8 | 29.0 | 20.3 | 28.2 | 27.8 |
| College Degree | 9.8 | 4.5 | 17.6 | 2.7 | 8.5 | 41.4 | 39.9 |
| Family Income | |||||||
| < $15,000 | 40.8 | 48.3 | 34.0 | 40.9 | 42.0 | 8.0 | 9.5 |
| $15,000 to $30,000 | 28.5 | 24.6 | 25.8 | 31.8 | 27.7 | 12.8 | 13.5 |
| $30,000 to $50,000 | 15.6 | 18.3 | 19.0 | 16.5 | 16.6 | 18.7 | 18.6 |
| >= $50,000 | 15.1 | 8.7 | 21.2 | 10.8 | 13.7 | 60.5 | 58.5 |
Notes: Estimates calculated using the 2021 FDIC Household Survey. In Panel A, the sample is limited to unbanked households.