
Chief Financial Officer's (CFO) Report to the Board
| Fund Financial Results | ($ in millions) |
| FSLIC Resolution Fund | |||||
Sep-18 |
Jun -18 |
Quarterly Change |
Sep -17 |
Year-Over-Year Change |
Cash and cash equivalents | $896 | $892 | $4 | $883 | $13 |
|---|---|---|---|---|---|
| Accumulated deficit | (124,593) | (124,597) | 4 | (124,606) | 13 |
| Total resolution equity | 897 | 893 | 4 | 884 | 13 |
| Total revenue | 11 | 7 | 4 | 5 | 6 |
| Operating expenses | 0 | 0 | 0 | 0 | 0 |
| Losses related to thrift resolutions | 0 | 0 | 0 | 0 | 0 |
| Net Income (Loss) | $11 | $7 | $4 | $5 | $6 |
| Receivership Selected Statistics September 2018 vs. September 2017 |
| $ in millions | DIF |
FRF |
ALL FUNDS |
||||||
|---|---|---|---|---|---|---|---|---|---|
| Sep-18 | Sep-17 | Change | Sep-18 | Sep-17 | Change | Sep-18 | Sep-17 | Change | Total Receiverships | 282 | 367 | (85) | - | - | - | 282 | 367 | (85) |
| Assets in Liquidation | $1,245 | $4,971 | ($3,726) | $2 | $2 | - | $1,247 | $4,973 | ($3,726) |
| YTD Collections | $1,333 | $1,260 | $73 | - | 1 | ($1) | $1,333 | $1,261 | $72 |
| YTD Dividend/ Other Pymts - Cash | $3,185 | $1,448 | $1,737 | - | - | - | $3,185 | $1,448 | $1,737 |
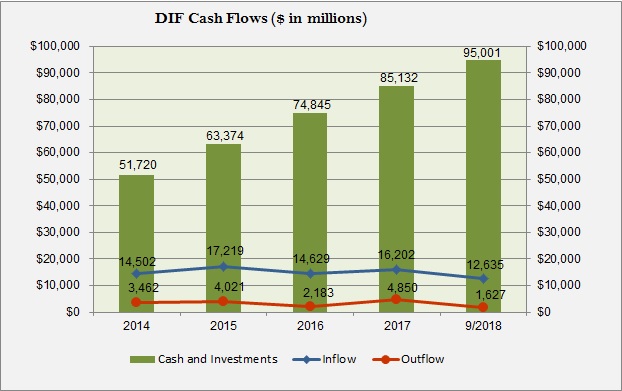
DIIF Cash Flows ($ in millions) |
|||
| Cash and Investments | Inflow | Outflow | |
|---|---|---|---|
| 2014 | 51,720 | 14,502 | 3,462 |
| 2015 | 63,374 | 17,219 | 4,021 |
| 2016 | 74,845 | 14,629 | 2,183 |
| 2017 | 85,132 | 16,202 | 4,850 |
| 9/2018 | 95,001 | 12,635 | 1,627 |
Cash and Investments increased by $43.3 billion from $51.7 billion at year-end 2014 to $95.0 billion at September 30, 2018. The increase was primarily due to assessment collections, interest on U.S. Treasury securities, and recoveries from resolutions, that far exceeded resolution-related outlays and operating expenses.